
")
Here is a list of the latest smart home statistics.
Thanks to advancements in Internet of Things (IoT) technology, smart home products are in higher demand than ever before.
But how big is the smart home industry? And what do consumers think about it?
Our latest smart home statistics provide insight into the current state of the smart home.
content
Top Smart Home Statistics – Editors' Picks
The global smart home market is expected to exceed $170 billion by 2025. 78% of home buyers are willing to pay extra for a smart home. About 75% of smart home consumers are under 55 years old. 97% of smart home device owners are at least somewhat satisfied with their devices. Nearly two-thirds of smart home consumers are concerned about data security. The average U.S. smart home has eight smart devices.
Smart Home Market Statistics
The market for smart homes and smart home technology has been steadily expanding since 2020. The following statistics outline the current state of the smart home market.
Global consumer spending on smart home systems is expected to exceed $170 billion by 2025 (Strategy Analytics)
Consumer spending on smart home technology is steadily increasing: Consumers worldwide are projected to spend $135 billion on smart home systems in 2022. By 2025, that figure is projected to grow to $170 billion (a growth rate of 26%).
Nearly three in five U.S. consumers are predicted to adopt smart home technology by 2025 (Statista)
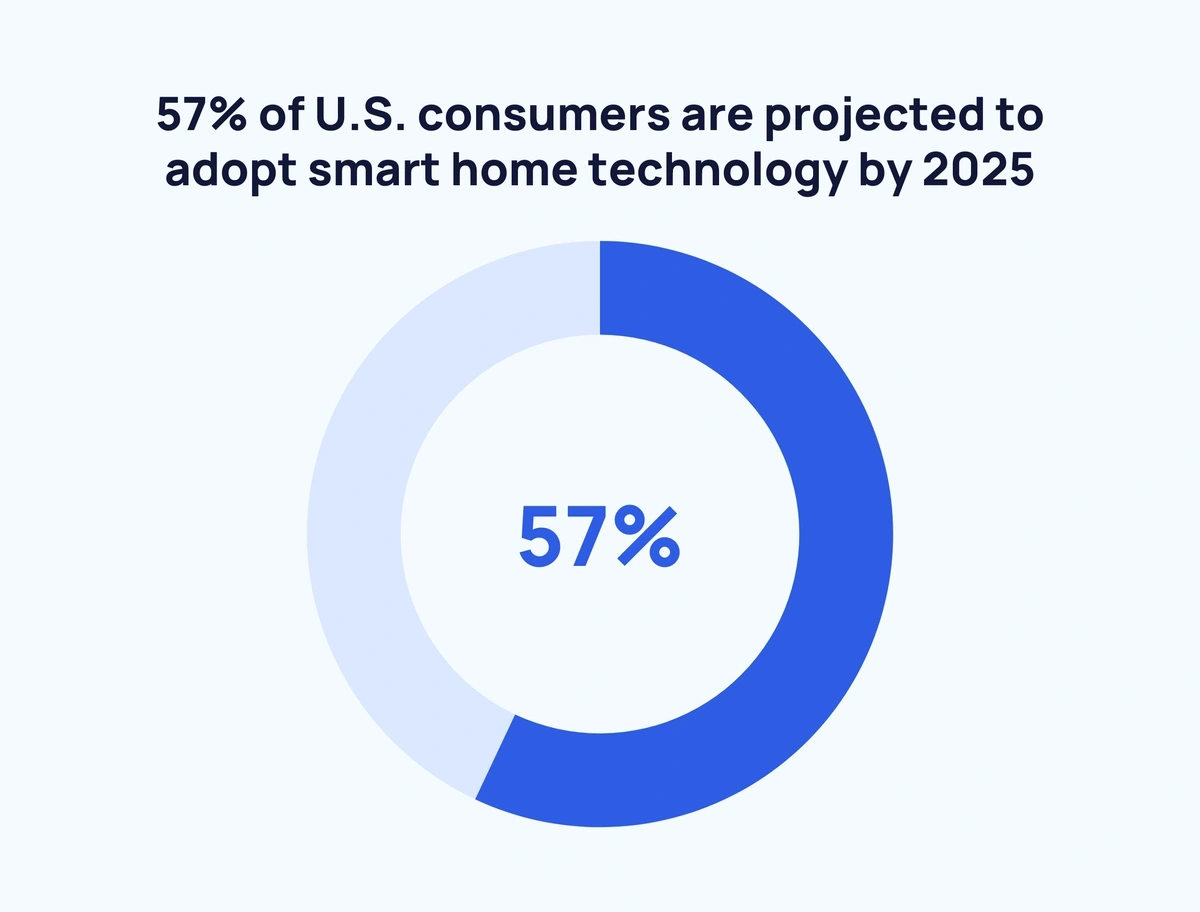
It's predicted that more than half of U.S. consumers will have adopted smart home technology by 2025. In 2021, only about 40% of U.S. households had smart home technology, which represents a 42% increase in smart home adoption in just four years.
North America accounts for 40% of total smart home consumer spending (Strategy Analytics)
The largest market for smart homes is North America, followed by Asia Pacific (29%) and Western Europe (18%). Smart home security systems in particular are driving growth in the US market.
Asia Pacific to be largest smart home market by 2023 (Strategy Analytics)
Asia Pacific is the fastest growing market for smart homes. With approximately 1 billion homes in the region and increasing consumer adoption, Asia Pacific is projected to be the largest smart home market by 2030.
Approximately three out of four smart home users are under 55 years old (Smart Energy Consumer Community)
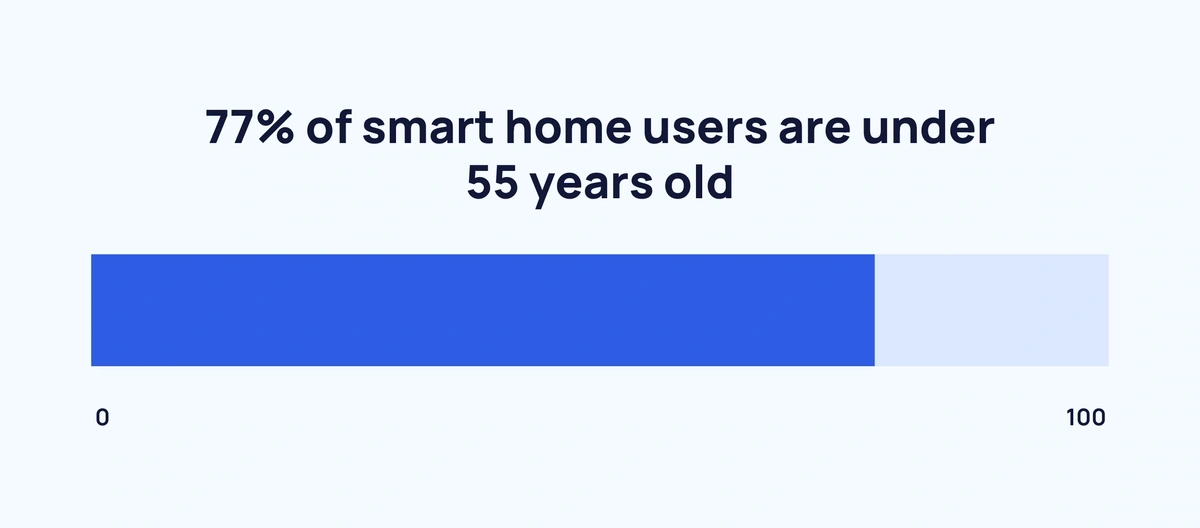
The majority of smart home users are Generation X and younger. In fact, 40% of smart home devices are owned by people between the ages of 18 and 34, who only make up about 30% of the population. Younger consumers generally understand the value of saving energy and reducing their impact on the environment.
Smart home demand statistics
A combination of demand and improved technology is driving the smart home market. This statistic will focus on consumer demand for smart homes.
Nearly three in four home buyers are willing to pay more for a smart home (Security.org)
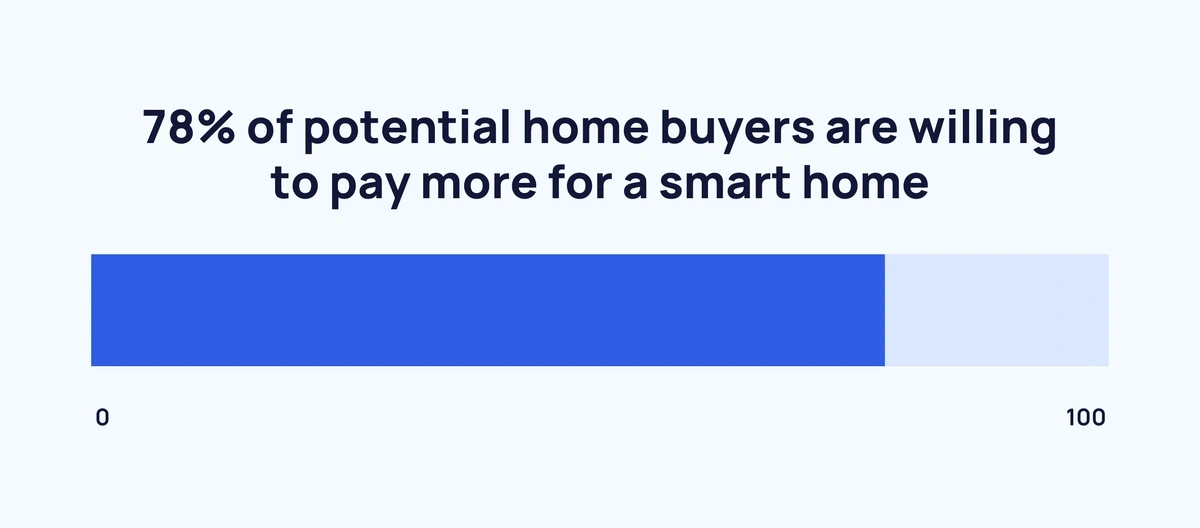
The majority of home buyers say they are willing to pay more for a smart home, and 70% of home buyers are actively considering a smart home purchase. Convenience, time savings, and security are some of the top reasons why people want a smart home.
82% of renters want at least one smart device or system in their home (Rent.com)
Smart homes aren't just for homeowners. The majority of renters (82%) would like to have a smart device or system in their home. Of those, 35% say it's “important” or “very important” to have a smart home device. Here are the top three most popular smart home technologies among renters:
1. Voice control (50%)
2. Smart appliances (41%)
3. Smart lights (36%)
46% of consumers adopt smart home technology for convenience (Hippo)
Convenience is the top reason consumers adopt smart home technology, and the second most common reason for using smart home technology is to keep an eye on your home while you're away (17%).
57% of people who don't have a smart home don't see the need for one (Smart Energy Consumer Collaborative)
Over half of consumers who have not adopted smart home technology do not see the need for it, with a major barrier being the price of most smart home devices. In particular, these consumers tend to skew older (55+)
Statistics on the benefits of smart homes
The high demand and rapid adoption of smart homes indicates that they are valued by consumers, and we provide smart home statistics that show the benefits to consumers.
The majority of smart home device owners are at least somewhat satisfied with their devices (Smart Energy Consumers Cooperative)
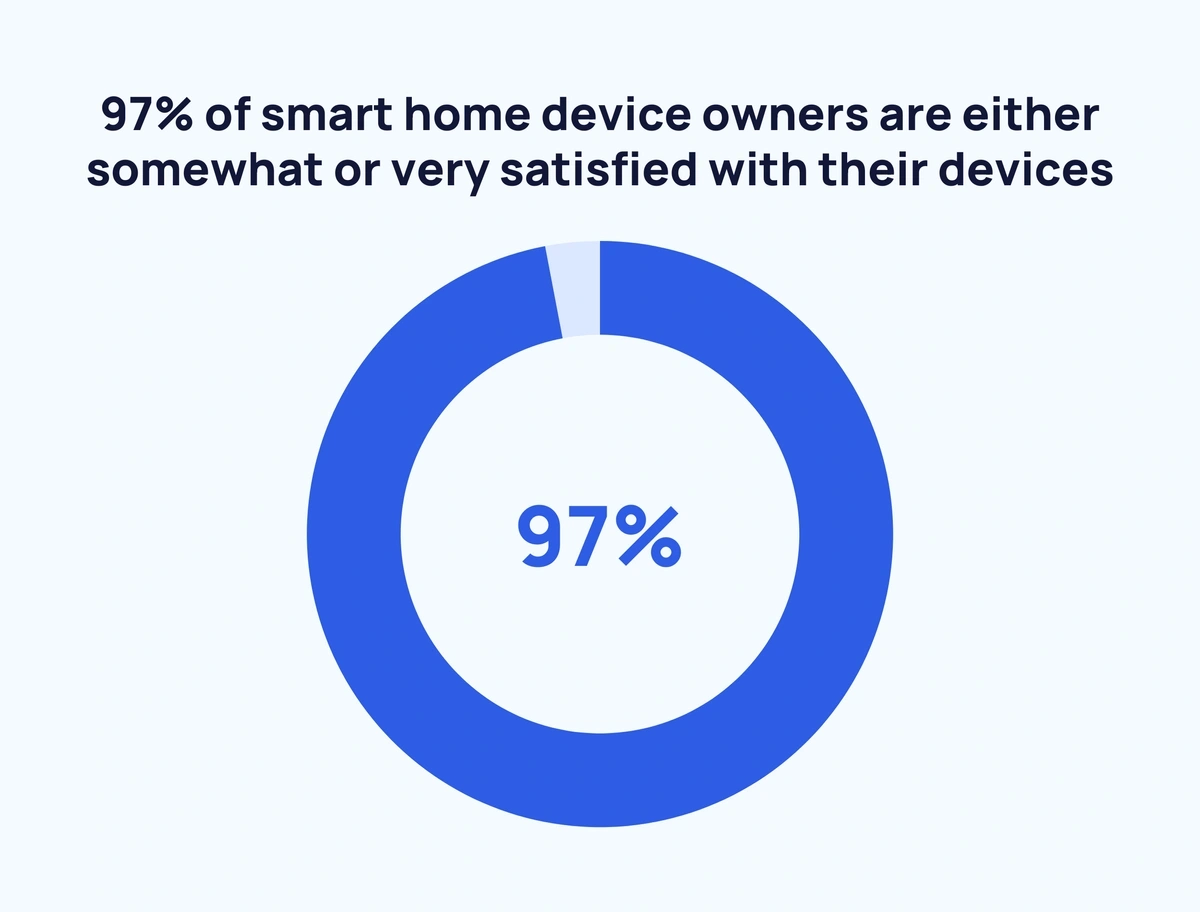
Smart home consumers are overwhelmingly satisfied. Nearly all owners of smart speakers, smart thermostats, smart plugs, smart lights and smart appliances are at least somewhat satisfied with their devices. Most owners (58%-64%) are very satisfied with their smart devices overall.
79% of consumers say smart home devices have a positive impact on their lives (Frontier)
Most consumers feel that smart home devices have a positive impact on their lives. The most common positive impacts were happiness at home (57%), safety and security (45%), and productivity (44%). These sentiments were consistent across different types of smart home devices.
71% of consumers find smart home devices more useful than they expected (Frontier)
The majority of consumers believe that smart homes have been more beneficial than they expected. The most commonly cited benefit is convenience (75%), followed by practicality (62%) and time saving (49%). Trial and error and recommendations from friends and family are likely reasons for the delayed implementation.
Statistics on Smart Home Concerns
Despite the continued growth of smart homes, the following data shows that concerns remain among both adopters and non-adopters of smart home technology.
Nearly four in five U.S. consumers have at least one concern about their smart home devices (YouGov)
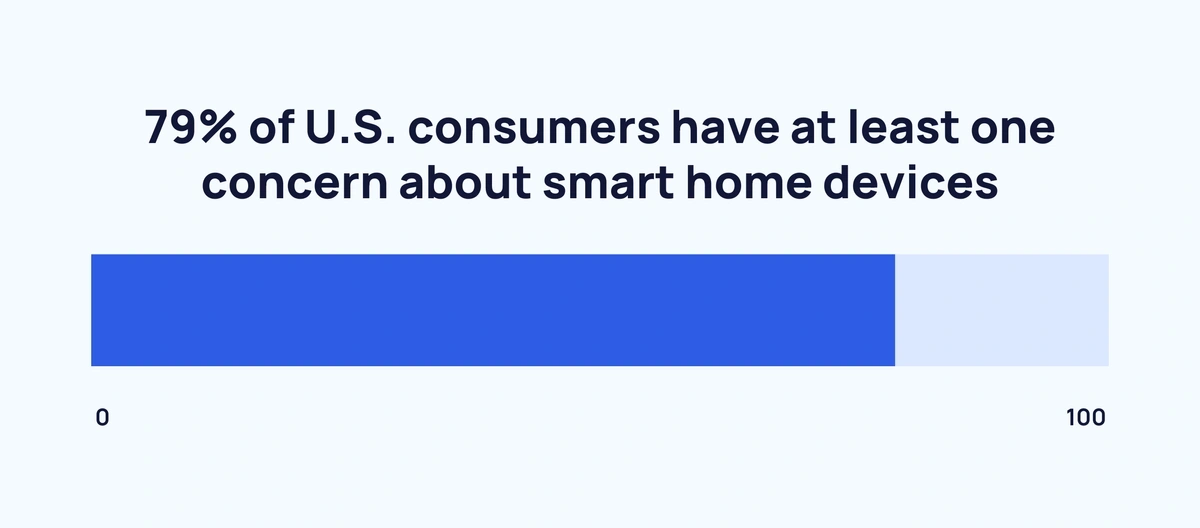
Only 21% of US consumers say they have no concerns about smart home devices. In addition to data security and privacy (the top concern), 33% say they are too expensive, 29% are concerned about usability if the internet goes down, 23% are worried about remembering passwords, and 22% worry about being locked out.
63% of smart home consumers are concerned about data leaks (Smart Energy Consumer Community)
Nearly two-thirds of smart home consumers are concerned about data leaks. Consumers who don't own smart home devices are even more concerned about data leaks, especially from third-party vendors and utility providers.
Nearly three-quarters of broadband households are concerned about the security of their personal data (Parks Associates)
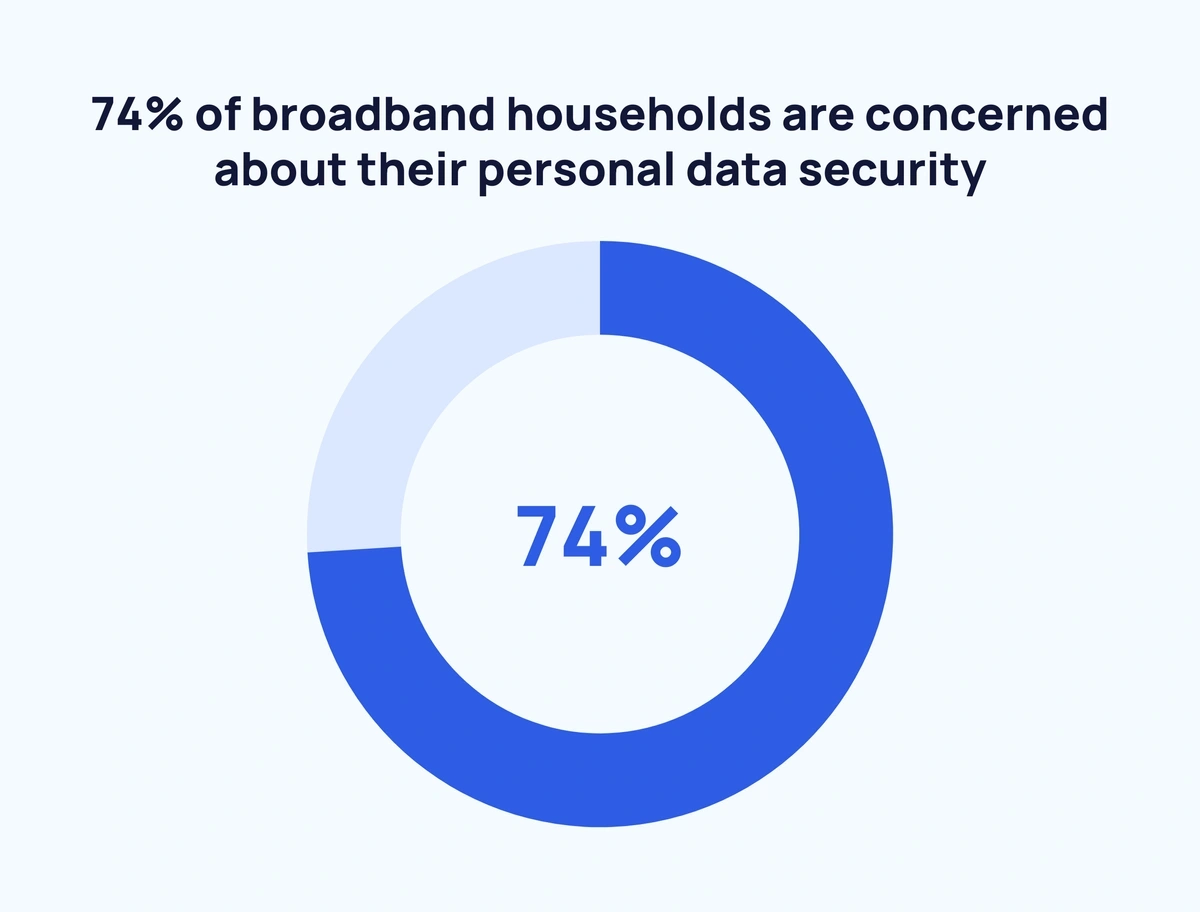
The majority of households with broadband internet are concerned about privacy and data security, and the more smart home devices in the home, the greater this concern becomes.
65% of Americans won't install smart home devices that collect personal data to get insurance discounts (PolicyGenius)
Most Americans would refuse to install smart home devices even if they were offered a discount on their insurance premiums. Their main concerns are privacy and the use of their personal information by third parties.
Smart Home Device Statistics
There are many different types of smart home devices on the market. Our statistics highlight the most popular ones.
The average U.S. household with smart home devices owns eight devices (Parks Associates)
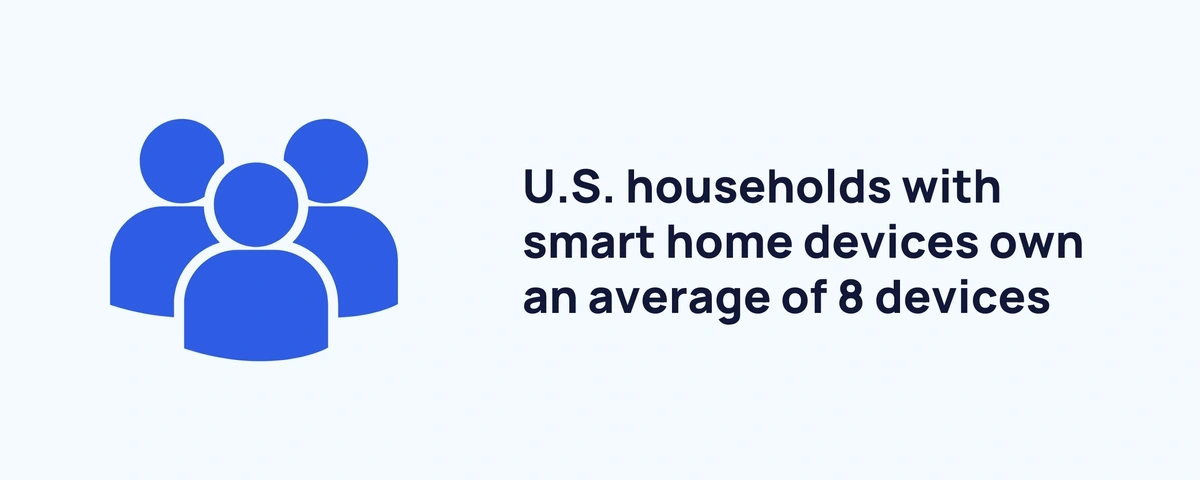
If households have smart home devices, they tend to have more than one: From 2018 to 2021, the average number of smart home devices increased from six to eight.
Smart home camera adoption to grow 55% from 2021 to 2022 (Plume)
According to one manufacturer's smart home data, customer adoption of smart home cameras has increased 55% in one year. Smart doorbells and smart hubs have also seen significant increases (43% and 38%, respectively). The data showed that the primary driver of adoption was improved comfort and safety in the home.
Over 70% of smart home appliance owners also own a smart speaker (Smart Energy Consumer Collaborative)
Owning certain smart home technologies paves the way for owning others: for example, 79% of smart light owners also own smart speakers, and 63% of smart appliance owners own smart thermostats. However, only 45% of smart speaker owners also own smart lights, suggesting potential growth in the smart speaker sector.
The average cost of installing a smart home device is $927 (HomeAdvisor)
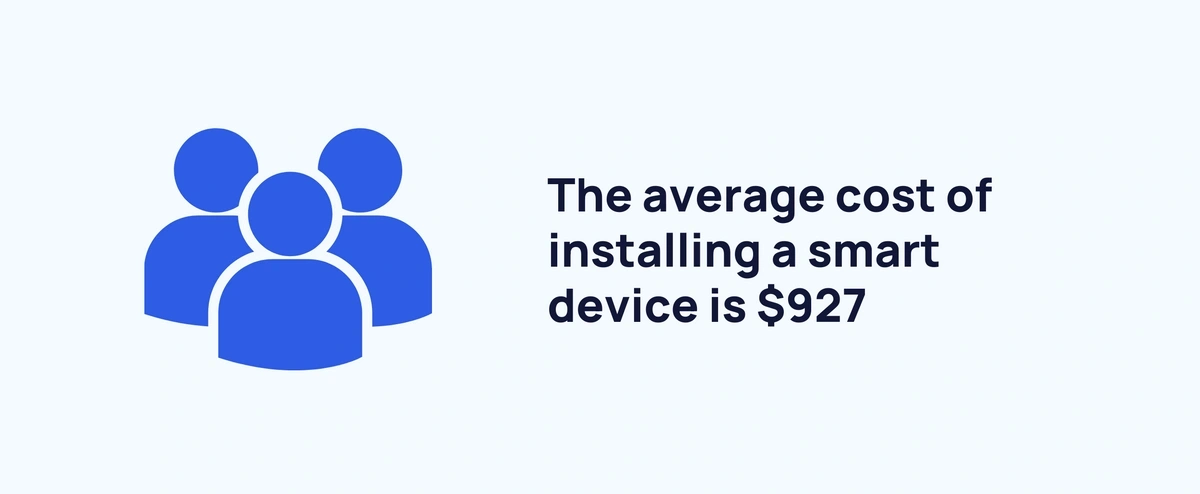
Consumers who install smart home devices in their homes will spend between $175 and $1,424 (average $927), with custom installations for larger or luxury homes costing anywhere from $2,000 to $150,000.
A smart home security system costs an average of $2,850 to install (HomeAdvisor)
Consumers who install smart home security devices in their homes will spend between $700 and $5,000 (average $2,850), with setups ranging from intruder alarms and doorbell cameras to whole-home security systems with automatic sensors and locks.
Conclusion
Here are the most important statistics about smart homes.
Smart home revenue, demand, and adoption are expected to grow steadily over the next few years, and owners of smart home devices are overwhelmingly satisfied with them. However, data privacy and security remain major concerns for both smart home adopters and non-adopters.
From a trend perspective, the data shows that:
(1) Smart home security is currently driving a large part of the smart home IoT industry.
(2) Once consumers adopt a smart home device, they tend to quickly adopt or purchase more.